
When you go to Results in the left menu under Quality control, you will see all forms and reports that have been completed for that organization or within that project.
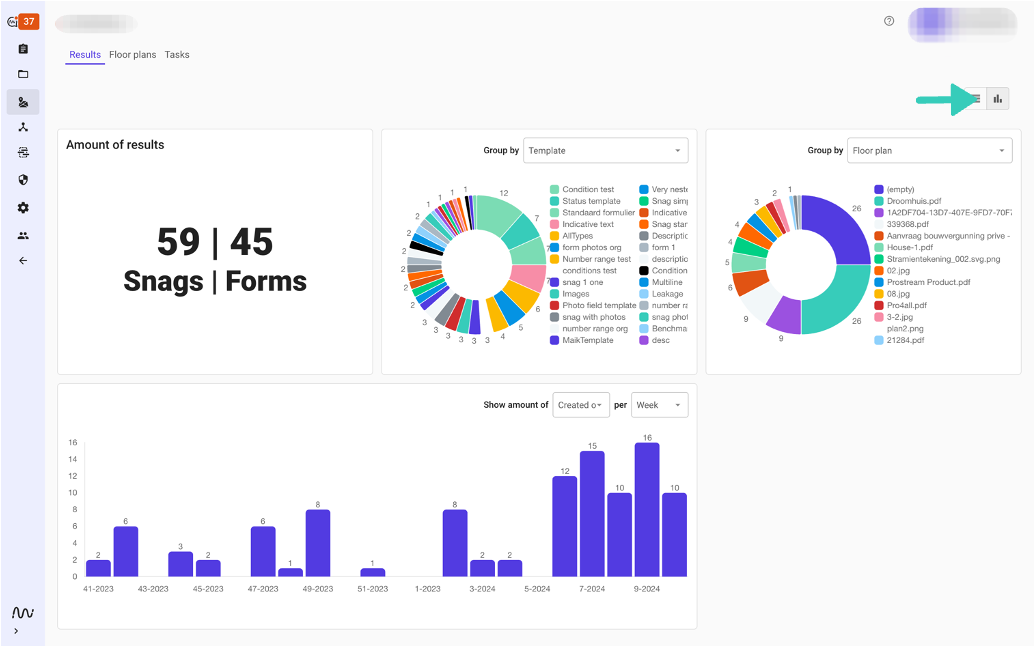
You are probably already familiar with the table overview - here you can see per row which metadata belongs to that form or snag. By clicking on the graph at the top right, you choose a dashboard overview of the data in that table.
You can then adjust the graphs to get the insights you are looking for. For example, group the data by template or map. You can also add filters.
